
Moorea Fund - Structured Income
The fund implements a total return strategy with the objective of generating over a 3 to 5 years period a higher income than corporate bonds market, but with less volatility. The fund will not be managed against any particular benchmark, in order to adapt and take advantage of the fast market evolutions.
An innovative strategy designed to take advantage of various market conditions.
Key features
Complementary performance drivers
A fixed income portfolio completed by an equity exposure, mainly composed of structured products (indices).
An investment strategy relying on arigorous security selection and a dynamic allocation
The investment strategy is the result of a rigorous investment vehicules selection, combined with a dynamic asset allocation, to take advantage of various market conditions.
A risk management at the heart of the investment process
A robust portfolio construction and an ongoing risk monitoring performed at the overall fund level.


| Share class | |
|---|---|
| Category | Multi-asset |
| Risk profile | 3 |
| Recommended investment period | 3-5 years |
| Isin Code | LU0538387076 |
| Investor profile | Retail |
| Currency | EUR |
| Dividend policy | Accumulation |
| Net Asset Value frequency | Daily |
| Initial Net Asset Value | 1000 EUR |
| Net Asset Value date | 09/07/2024 |
| Net Asset Value | 1 270.00 |
| Monthly report | |
| KIID | |
| Tax publication | |
| Category | Multi-asset |
| Risk profile | 3 |
| Recommended investment period | 3-5 years |
| Isin Code | LU0859659996 |
| Investor profile | Retail |
| Currency | EUR |
| Dividend policy | Distribution |
| Net Asset Value frequency | Daily |
| Initial Net Asset Value | 1000 EUR |
| Net Asset Value date | 09/07/2024 |
| Net Asset Value | 1 012.29 |
| Monthly report | |
| KIID | |
| Tax publication | |
| Category | Multi-asset |
| Risk profile | 3 |
| Recommended investment period | 3-5 years |
| Isin Code | LU0979137147 |
| Investor profile | Retail |
| Currency | USD |
| Dividend policy | Accumulation |
| Net Asset Value frequency | Daily |
| Initial Net Asset Value | 1000 USD |
| Net Asset Value date | 09/07/2024 |
| Net Asset Value | 1 503.05 |
| Monthly report | |
| KIID | |
| Tax publication | |
| Category | Multi-asset |
| Risk profile | 3 |
| Recommended investment period | 3-5 years |
| Isin Code | LU0979137493 |
| Investor profile | Retail |
| Currency | USD |
| Dividend policy | Distribution |
| Net Asset Value frequency | Daily |
| Initial Net Asset Value | 1000 USD |
| Net Asset Value date | 09/07/2024 |
| Net Asset Value | 1 156.03 |
| KIID | |
| Tax publication | |
| Category | Multi-asset |
| Risk profile | 3 |
| Recommended investment period | 3-5 years |
| Isin Code | LU1664185268 |
| Investor profile | Mandate |
| Currency | EUR |
| Dividend policy | Accumulation |
| Net Asset Value frequency | Daily |
| Initial Net Asset Value | 1000 EUR |
| Net Asset Value date | 09/07/2024 |
| Net Asset Value | 1 160.89 |
| KIID | |
| Tax publication | |
| Category | Multi-asset |
| Risk profile | 3 |
| Recommended investment period | 3-5 years |
| Isin Code | LU1664185342 |
| Investor profile | Mandate |
| Currency | EUR |
| Dividend policy | Distribution |
| Net Asset Value frequency | Daily |
| Initial Net Asset Value | 1000 EUR |
| Net Asset Value date | 09/07/2024 |
| Net Asset Value | 1 014.20 |
| KIID | |
| Tax publication | |
| Category | Multi-asset |
| Risk profile | 3 |
| Recommended investment period | 3-5 years |
| Isin Code | LU1664185425 |
| Investor profile | Mandate |
| Currency | USD |
| Dividend policy | Accumulation |
| Net Asset Value frequency | Daily |
| Initial Net Asset Value | 1000 USD |
| Net Asset Value date | 09/07/2024 |
| Net Asset Value | 1 245.37 |
| KIID | |
| Tax publication | |
| Category | Multi-asset |
| Risk profile | 3 |
| Recommended investment period | 3-5 years |
| Isin Code | LU1664185698 |
| Investor profile | Mandate |
| Currency | USD |
| Dividend policy | Distribution |
| Net Asset Value frequency | Daily |
| Initial Net Asset Value | 1000 USD |
| Net Asset Value date | 09/07/2024 |
| Net Asset Value | 1 110.31 |
| KIID | |
| Tax publication | |
| Category | Multi-asset |
| Risk profile | 3 |
| Recommended investment period | 3-5 years |
| Isin Code | LU2108470654 |
| Investor profile | Institutional |
| Currency | EUR |
| Dividend policy | Accumulation |
| Net Asset Value frequency | Daily |
| Initial Net Asset Value | 1000 EUR |
| Net Asset Value date | 09/07/2024 |
| Net Asset Value | 1 135.75 |
| Monthly report | |
| KIID | |
| Tax publication |
An innovative strategy to take advantage of various market conditions
The strategy implemented in Moorea Fund - Structured Income is particularly innovative and combines two complementary performance
sources: a fixed income portfolio completed by an opportunistic diversification in structured products to offer an additional performance
driver based on the stock market volatility.
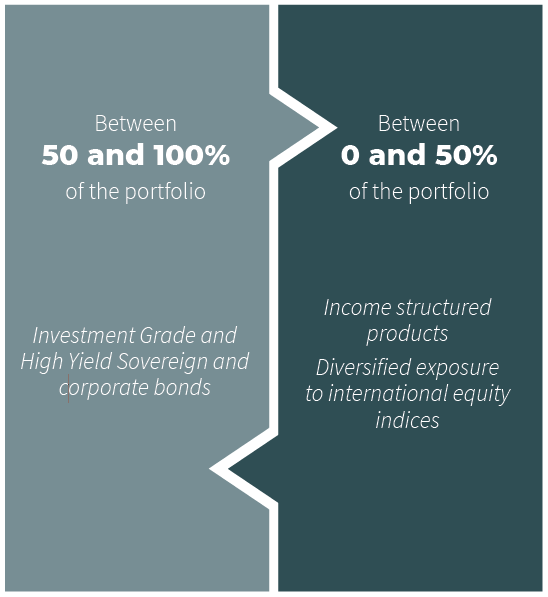
BONDS
The portfolio management team may invest in investment grade and high yield corporate bonds, sovereign bonds without any particular constraints in terms of rating, region or maturity.
The fund favors corporate bonds through a rigorous selection of the issuers. The portfolio resulting from the selection is well diversified (40 holdings in average on 20 sectors).
STRUCTURED PRODUCTS
In the frame of the strategy, the management team favors income generating structured products, with international equity indices as underlying.
The bucket is built following strict guidelines in term of diversification (underlyings, observation date, counterparties).
Performances
Performance scenarios
Performance scenarios
Data as of //0/24/0
Hypothetical 10000 EUR investment
| Scenarios | 1 year | 5 years * |
|---|---|---|
| Stress | ||
| What you might get back after costs (EUR) | € 3,201.837 | € 3,420.156 |
| Average return each year (%) | -67.98% | -19.31% |
| Unfavorable | ||
| What you might get back after costs (EUR) | € 7,974.135 | € 8,606.298 |
| Average return each year (%) | -20.26% | -2.96% |
| Moderate | ||
| What you might get back after costs (EUR) | € 9,618.226 | € 10,396.594 |
| Average return each year (%) | -3.82% | 0.78% |
| Favorable | ||
| What you might get back after costs (EUR) | € 11,750.514 | € 11,750.617 |
| Average return each year (%) | 17.51% | 3.28% |
*Recommanded holding period
Download
Performance scenarios
Data as of //0/24/0
Hypothetical 10000 EUR investment
| Scenarios | 1 year | 5 years * |
|---|---|---|
| Stress | ||
| What you might get back after costs (EUR) | € 4,278.928 | € 4,714.657 |
| Average return each year (%) | -57.21% | -13.96% |
| Unfavorable | ||
| What you might get back after costs (EUR) | € 7,973.619 | € 8,605.954 |
| Average return each year (%) | -20.26% | -2.96% |
| Moderate | ||
| What you might get back after costs (EUR) | € 9,618.262 | € 10,391.158 |
| Average return each year (%) | -3.82% | 0.77% |
| Favorable | ||
| What you might get back after costs (EUR) | € 11,748.365 | € 11,747.383 |
| Average return each year (%) | 17.48% | 3.27% |
*Recommanded holding period
Download
Performance scenarios
Data as of //0/24/0
Hypothetical 10000 USD investment
| Scenarios | 1 year | 5 years * |
|---|---|---|
| Stress | ||
| What you might get back after costs (USD) | $ 4,249.482 | $ 4,710.677 |
| Average return each year (%) | -57.51% | -13.98% |
| Unfavorable | ||
| What you might get back after costs (USD) | $ 8,197.633 | $ 9,334.998 |
| Average return each year (%) | -18.02% | -1.37% |
| Moderate | ||
| What you might get back after costs (USD) | $ 9,769.439 | $ 11,208.075 |
| Average return each year (%) | -2.31% | 2.31% |
| Favorable | ||
| What you might get back after costs (USD) | $ 11,853.660 | $ 12,844.879 |
| Average return each year (%) | 18.54% | 5.13% |
*Recommanded holding period
Download
Performance scenarios
Data as of //0/24/0
Hypothetical 10000 USD investment
| Scenarios | 1 year | 5 years * |
|---|---|---|
| Stress | ||
| What you might get back after costs (USD) | $ 4,251.778 | $ 4,708.050 |
| Average return each year (%) | -57.48% | -13.99% |
| Unfavorable | ||
| What you might get back after costs (USD) | $ 8,193.859 | $ 9,291.852 |
| Average return each year (%) | -18.06% | -1.46% |
| Moderate | ||
| What you might get back after costs (USD) | $ 9,764.346 | $ 11,181.383 |
| Average return each year (%) | -2.36% | 2.26% |
| Favorable | ||
| What you might get back after costs (USD) | $ 11,853.713 | $ 12,807.841 |
| Average return each year (%) | 18.54% | 5.07% |
*Recommanded holding period
Download
Performance scenarios
Data as of //0/24/0
Hypothetical 10000 EUR investment
| Scenarios | 1 year | 5 years * |
|---|---|---|
| Stress | ||
| What you might get back after costs (EUR) | € 3,142.785 | € 3,692.177 |
| Average return each year (%) | -68.57% | -18.07% |
| Unfavorable | ||
| What you might get back after costs (EUR) | € 7,993.488 | € 8,651.820 |
| Average return each year (%) | -20.07% | -2.85% |
| Moderate | ||
| What you might get back after costs (EUR) | € 9,642.004 | € 10,507.214 |
| Average return each year (%) | -3.58% | 0.99% |
| Favorable | ||
| What you might get back after costs (EUR) | € 11,779.943 | € 11,849.693 |
| Average return each year (%) | 17.8% | 3.45% |
*Recommanded holding period
Download
Performance scenarios
Data as of //0/24/0
Hypothetical 10000 EUR investment
| Scenarios | 1 year | 5 years * |
|---|---|---|
| Stress | ||
| What you might get back after costs (EUR) | € 3,161.381 | € 3,696.520 |
| Average return each year (%) | -68.39% | -18.05% |
| Unfavorable | ||
| What you might get back after costs (EUR) | € 7,993.842 | € 8,322.145 |
| Average return each year (%) | -20.06% | -3.61% |
| Moderate | ||
| What you might get back after costs (EUR) | € 9,602.432 | € 10,206.636 |
| Average return each year (%) | -3.98% | 0.41% |
| Favorable | ||
| What you might get back after costs (EUR) | € 11,778.303 | € 11,397.871 |
| Average return each year (%) | 17.78% | 2.65% |
*Recommanded holding period
Download
Performance scenarios
Data as of //0/24/0
Hypothetical 10000 USD investment
| Scenarios | 1 year | 5 years * |
|---|---|---|
| Stress | ||
| What you might get back after costs (USD) | $ 3,128.081 | $ 3,692.474 |
| Average return each year (%) | -68.72% | -18.07% |
| Unfavorable | ||
| What you might get back after costs (USD) | $ 8,200.775 | $ 8,848.149 |
| Average return each year (%) | -17.99% | -2.42% |
| Moderate | ||
| What you might get back after costs (USD) | $ 9,696.484 | $ 10,738.086 |
| Average return each year (%) | -3.04% | 1.43% |
| Favorable | ||
| What you might get back after costs (USD) | $ 11,872.369 | $ 12,224.128 |
| Average return each year (%) | 18.72% | 4.1% |
*Recommanded holding period
Download
Performance scenarios
Data as of //0/24/0
Hypothetical 10000 USD investment
| Scenarios | 1 year | 5 years * |
|---|---|---|
| Stress | ||
| What you might get back after costs (USD) | $ 4,053.436 | $ 4,054.722 |
| Average return each year (%) | -59.47% | -16.52% |
| Unfavorable | ||
| What you might get back after costs (USD) | $ 8,401.839 | $ 9,532.298 |
| Average return each year (%) | -15.98% | -0.95% |
| Moderate | ||
| What you might get back after costs (USD) | $ 9,831.645 | $ 11,276.528 |
| Average return each year (%) | -1.68% | 2.43% |
| Favorable | ||
| What you might get back after costs (USD) | $ 11,123.576 | $ 12,228.340 |
| Average return each year (%) | 11.24% | 4.11% |
*Recommanded holding period
Download
Performance scenarios
Data as of //0/24/0
Hypothetical 10000 EUR investment
| Scenarios | 1 year | 5 years * |
|---|---|---|
| Stress | ||
| What you might get back after costs (EUR) | € 3,020.560 | € 5,863.005 |
| Average return each year (%) | -69.79% | -10.13% |
| Unfavorable | ||
| What you might get back after costs (EUR) | € 7,970.809 | € 8,602.708 |
| Average return each year (%) | -20.29% | -2.97% |
| Moderate | ||
| What you might get back after costs (EUR) | € 9,618.226 | € 10,483.602 |
| Average return each year (%) | -3.82% | 0.95% |
| Favorable | ||
| What you might get back after costs (EUR) | € 11,825.890 | € 11,839.927 |
| Average return each year (%) | 18.26% | 3.44% |
*Recommanded holding period
Download
Past performance should not be seen as an indicator of future performance.
Associated risks
- Investments may be subject to market fluctuations and the price and value of investments and the income derived from them can go down as well as up. Your capital may be at risk and you may not get back the amount you invest.
- Counterparty Risk: Refers to the risk of counterparty default resulting in non-payment. The fund may be exposed to counterparty risk through the use of Over The Counter (OTC) derivatives entered into by mutual agreement with a credit institution.
- Liquidity Risk: Refers to the possibility that the fund may loose money or be prevented from earning capital gains if it cannot sell a security at the time and price that is most beneficial to the fund and may be unable to raise cash to meet redemption requests.
- Credit Risk: Refers to the likelihood of the fund lose money if an issuer is unable to meet its financial obligations, such as the payment of principal and/or interest on an instrument.
- Operational Risk: It refers to a failure or delay in the system, processes and controls of the fund or its service providers which could lead to losses for the fund.
- Market Risk: Refers to the possibility for an investor to experience losses due to the overall performance of the financial markets.
Before investing, investors must be aware that certain markets may be subject to rapid fluctuations and are speculative or lacking in liquidity. Accordingly, certain assets or categories of assets listed on this website may not be appropriate for some investors. Investors are therefore urged to seek the advice of their financial advisor or intermediary in order to assess the particular nature of an investment and the risks involved and its compatibility with their individual investment profile and objectives.