
Moorea Fund - Euro Fixed Income
Moorea Fund – Euro Fixed Income seeks to generate regular income through diversified investments in fixed income instruments mainly denominated in euro. To achieve its objective, the portfolio management team focuses on a broad range of debt securities and related instruments.
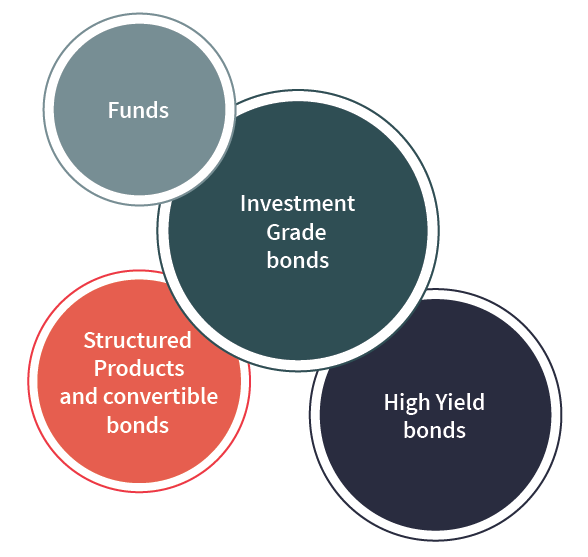
Access the whole range of opportunities in the fixed income universe
Key features
A flexible and diversified portfolio management
A diversified fixed income fund, focusing on the Eurozone, that aims to deliver regular income across all segments of the fixed income market.
An active management
The fund is actively managed with the aim to optimise the portfolio’s risk/return profile. Our investment selection and allocation to various fixed income segments are undertaken after an in-depth analysis of the microeconomic and macroeconomic factors.
A risk management at the heart of our investment process
The fund focuses on minimising the average default risk by analysing the various risk factors inherent to bonds.
A responsible fund
Moorea Euro Fixed Income has been awarded the "Luxflag ESG Label". The labelling of the fund is the result of the work carried out to combine corporate social responsibility and sustainable financial performance in the management of the fund.
Moorea Fund - Euro Fixed Income has been awarded the ESG Luxflag label*.


| Share class | |
|---|---|
| Category | Fixed Income |
| Risk profile | 2 |
| Recommended investment period | 5 years |
| Isin Code | LU1023727867 |
| Investor profile | Retail |
| Currency | EUR |
| Dividend policy | Accumulation |
| Net Asset Value frequency | Daily |
| Initial Net Asset Value | 250 EUR |
| Net Asset Value date | 09/07/2024 |
| Net Asset Value | 290.55 |
| Monthly report | |
| KIID | |
| Tax publication | |
| Category | Fixed Income |
| Risk profile | 2 |
| Recommended investment period | 5 years |
| Isin Code | LU1023727941 |
| Investor profile | Retail |
| Currency | EUR |
| Dividend policy | Distribution |
| Net Asset Value frequency | Daily |
| Initial Net Asset Value | 250 EUR |
| Net Asset Value date | 09/07/2024 |
| Net Asset Value | 227.67 |
| Monthly report | |
| KIID | |
| Tax publication | |
| Category | Fixed Income |
| Risk profile | 2 |
| Recommended investment period | 5 years |
| Isin Code | LU1023728089 |
| Investor profile | Institutional |
| Currency | EUR |
| Dividend policy | Accumulation |
| Net Asset Value frequency | Daily |
| Initial Net Asset Value | 250 EUR |
| Net Asset Value date | 09/07/2024 |
| Net Asset Value | 299.16 |
| Monthly report | |
| KIID | |
| Tax publication | |
| Category | Fixed Income |
| Risk profile | 2 |
| Recommended investment period | 5 years |
| Isin Code | LU1137258932 |
| Investor profile | Retail |
| Currency | USD |
| Dividend policy | Accumulation |
| Net Asset Value frequency | Daily |
| Initial Net Asset Value | 250 USD |
| Net Asset Value date | 09/07/2024 |
| Net Asset Value | 325.11 |
| Monthly report | |
| KIID | |
| Tax publication | |
| Category | Fixed Income |
| Risk profile | 2 |
| Recommended investment period | 5 years |
| Isin Code | LU1137259153 |
| Investor profile | Retail |
| Currency | USD |
| Dividend policy | Distribution |
| Net Asset Value frequency | Daily |
| Initial Net Asset Value | 250 USD |
| Net Asset Value date | 09/07/2024 |
| Net Asset Value | 248.23 |
| KIID | |
| Tax publication | |
| Category | Fixed Income |
| Risk profile | 2 |
| Recommended investment period | 5 years |
| Isin Code | LU1664187124 |
| Investor profile | Mandate |
| Currency | EUR |
| Dividend policy | Accumulation |
| Net Asset Value frequency | Daily |
| Initial Net Asset Value | 250 EUR |
| Net Asset Value date | 09/07/2024 |
| Net Asset Value | 267.14 |
| KIID | |
| Tax publication | |
| Category | Fixed Income |
| Risk profile | 2 |
| Recommended investment period | 5 years |
| Isin Code | LU1664187397 |
| Investor profile | Mandate |
| Currency | EUR |
| Dividend policy | Distribution |
| Net Asset Value frequency | Daily |
| Initial Net Asset Value | 250 EUR |
| Net Asset Value date | 09/07/2024 |
| Net Asset Value | 233.62 |
| KIID | |
| Tax publication | |
| Category | Fixed Income |
| Risk profile | 2 |
| Recommended investment period | 5 years |
| Isin Code | LU1664187470 |
| Investor profile | Mandate |
| Currency | USD |
| Dividend policy | Accumulation |
| Net Asset Value frequency | Daily |
| Initial Net Asset Value | 250 USD |
| Net Asset Value date | 09/07/2024 |
| Net Asset Value | 297.76 |
| KIID | |
| Tax publication |

*LuxFLAG est une association sans but lucratif, indépendante, internationale créée au Luxembourg en juillet 2006. LuxFLAG a pour objectif de donner aux investisseurs l’assurance que les fonds qui portent son label intègrent des critères environnementaux, sociaux et de gouvernance (ESG) à chaque étape de leur processus d’investissement.
Performances
Performance scenarios
Performance scenarios
Data as of //0/24/0
Hypothetical 10000 EUR investment
| Scenarios | 1 year | 5 years * |
|---|---|---|
| Stress | ||
| What you might get back after costs (EUR) | € 6,415.417 | € 6,622.045 |
| Average return each year (%) | -35.85% | -7.91% |
| Unfavorable | ||
| What you might get back after costs (EUR) | € 8,247.043 | € 8,736.015 |
| Average return each year (%) | -17.53% | -2.67% |
| Moderate | ||
| What you might get back after costs (EUR) | € 9,626.286 | € 10,232.259 |
| Average return each year (%) | -3.74% | 0.46% |
| Favorable | ||
| What you might get back after costs (EUR) | € 10,499.043 | € 10,630.617 |
| Average return each year (%) | 4.99% | 1.23% |
*Recommanded holding period
Download
Performance scenarios
Data as of //0/24/0
Hypothetical 10000 EUR investment
| Scenarios | 1 year | 5 years * |
|---|---|---|
| Stress | ||
| What you might get back after costs (EUR) | € 6,427.444 | € 6,624.669 |
| Average return each year (%) | -35.73% | -7.91% |
| Unfavorable | ||
| What you might get back after costs (EUR) | € 8,246.092 | € 8,734.158 |
| Average return each year (%) | -17.54% | -2.67% |
| Moderate | ||
| What you might get back after costs (EUR) | € 9,626.287 | € 10,229.989 |
| Average return each year (%) | -3.74% | 0.46% |
| Favorable | ||
| What you might get back after costs (EUR) | € 10,497.752 | € 10,701.221 |
| Average return each year (%) | 4.98% | 1.36% |
*Recommanded holding period
Download
Performance scenarios
Data as of //0/24/0
Hypothetical 10000 EUR investment
| Scenarios | 1 year | 5 years * |
|---|---|---|
| Stress | ||
| What you might get back after costs (EUR) | € 6,415.390 | € 6,622.139 |
| Average return each year (%) | -35.85% | -7.91% |
| Unfavorable | ||
| What you might get back after costs (EUR) | € 8,266.809 | € 8,841.494 |
| Average return each year (%) | -17.33% | -2.43% |
| Moderate | ||
| What you might get back after costs (EUR) | € 9,649.244 | € 10,355.524 |
| Average return each year (%) | -3.51% | 0.7% |
| Favorable | ||
| What you might get back after costs (EUR) | € 10,524.563 | € 10,758.739 |
| Average return each year (%) | 5.25% | 1.47% |
*Recommanded holding period
Download
Performance scenarios
Data as of //0/24/0
Hypothetical 10000 USD investment
| Scenarios | 1 year | 5 years * |
|---|---|---|
| Stress | ||
| What you might get back after costs (USD) | $ 6,411.358 | $ 6,627.173 |
| Average return each year (%) | -35.89% | -7.9% |
| Unfavorable | ||
| What you might get back after costs (USD) | $ 8,357.042 | $ 9,293.197 |
| Average return each year (%) | -16.43% | -1.46% |
| Moderate | ||
| What you might get back after costs (USD) | $ 9,695.044 | $ 10,993.015 |
| Average return each year (%) | -3.05% | 1.91% |
| Favorable | ||
| What you might get back after costs (USD) | $ 10,574.007 | $ 11,577.341 |
| Average return each year (%) | 5.74% | 2.97% |
*Recommanded holding period
Download
Performance scenarios
Data as of //0/24/0
Hypothetical 10000 USD investment
| Scenarios | 1 year | 5 years * |
|---|---|---|
| Stress | ||
| What you might get back after costs (USD) | $ 6,349.322 | $ 7,925.926 |
| Average return each year (%) | -36.51% | -4.54% |
| Unfavorable | ||
| What you might get back after costs (USD) | $ 8,346.157 | $ 9,271.687 |
| Average return each year (%) | -16.54% | -1.5% |
| Moderate | ||
| What you might get back after costs (USD) | $ 9,695.044 | $ 10,993.015 |
| Average return each year (%) | -3.05% | 1.91% |
| Favorable | ||
| What you might get back after costs (USD) | $ 10,565.795 | $ 11,650.965 |
| Average return each year (%) | 5.66% | 3.1% |
*Recommanded holding period
Download
Performance scenarios
Data as of //0/24/0
Hypothetical 10000 EUR investment
| Scenarios | 1 year | 5 years * |
|---|---|---|
| Stress | ||
| What you might get back after costs (EUR) | € 6,415.553 | € 6,622.390 |
| Average return each year (%) | -35.84% | -7.91% |
| Unfavorable | ||
| What you might get back after costs (EUR) | € 8,259.107 | € 8,797.264 |
| Average return each year (%) | -17.41% | -2.53% |
| Moderate | ||
| What you might get back after costs (EUR) | € 9,640.254 | € 10,291.310 |
| Average return each year (%) | -3.6% | 0.58% |
| Favorable | ||
| What you might get back after costs (EUR) | € 10,515.456 | € 10,654.119 |
| Average return each year (%) | 5.15% | 1.28% |
*Recommanded holding period
Download
Performance scenarios
Data as of //0/24/0
Hypothetical 10000 EUR investment
| Scenarios | 1 year | 5 years * |
|---|---|---|
| Stress | ||
| What you might get back after costs (EUR) | € 6,395.287 | € 6,607.713 |
| Average return each year (%) | -36.05% | -7.95% |
| Unfavorable | ||
| What you might get back after costs (EUR) | € 8,257.866 | € 8,474.303 |
| Average return each year (%) | -17.42% | -3.26% |
| Moderate | ||
| What you might get back after costs (EUR) | € 9,561.802 | € 9,773.536 |
| Average return each year (%) | -4.38% | -0.46% |
| Favorable | ||
| What you might get back after costs (EUR) | € 10,515.731 | € 10,255.717 |
| Average return each year (%) | 5.16% | 0.51% |
*Recommanded holding period
Download
Performance scenarios
Data as of //0/24/0
Hypothetical 10000 USD investment
| Scenarios | 1 year | 5 years * |
|---|---|---|
| Stress | ||
| What you might get back after costs (USD) | $ 6,389.784 | $ 6,615.755 |
| Average return each year (%) | -36.1% | -7.93% |
| Unfavorable | ||
| What you might get back after costs (USD) | $ 8,373.205 | $ 9,327.392 |
| Average return each year (%) | -16.27% | -1.38% |
| Moderate | ||
| What you might get back after costs (USD) | $ 9,704.396 | $ 10,777.399 |
| Average return each year (%) | -2.96% | 1.51% |
| Favorable | ||
| What you might get back after costs (USD) | $ 10,574.240 | $ 11,333.109 |
| Average return each year (%) | 5.74% | 2.53% |
*Recommanded holding period
Download
Past performance should not be seen as an indicator of future performance.
Associated risks
- Investments may be subject to market fluctuations and the price and value of investments and the income derived from them can go down as well as up. Your capital may be at risk and you may not get back the amount you invest.
- Counterparty Risk: Refers to the risk of counterparty default resulting in non-payment. The fund may be exposed to counterparty risk through the use of Over The Counter (OTC) derivatives entered into by mutual agreement with a credit institution.
- Liquidity Risk: Refers to the possibility that the fund may loose money or be prevented from earning capital gains if it cannot sell a security at the time and price that is most beneficial to the fund and may be unable to raise cash to meet redemption requests.
- Credit Risk: Refers to the likelihood of the fund lose money if an issuer is unable to meet its financial obligations, such as the payment of principal and/or interest on an instrument.
- Operational Risk: It refers to a failure or delay in the system, processes and controls of the fund or its service providers which could lead to losses for the fund.
- Market Risk: Refers to the possibility for an investor to experience losses due to the overall performance of the financial markets.
- Concentration Risk: Refers to the risk of significant losses if the fund holds a large position in a particular investment that declines in value or is otherwise adversely affected, including default of the issuer.
Before investing, investors must be aware that certain markets may be subject to rapid fluctuations and are speculative or lacking in liquidity. Accordingly, certain assets or categories of assets listed on this website may not be appropriate for some investors. Investors are therefore urged to seek the advice of their financial advisor or intermediary in order to assess the particular nature of an investment and the risks involved and its compatibility with their individual investment profile and objectives.