
Moorea Fund - European Equity Quality Income
The Sub-Fund Moorea Fund – European Equity Quality Income seeks to provide long-term capital appreciation over a cycle of 5 years, primarily through investments in a portfolio of European Equities.
The aim of the Sub-Fund is to identify companies that exhibit sustainable quality and income characteristics.
Investors don’t have to choose between growth and stability as long as they focus on high-quality companies.
Key features
Focus on Quality
The fund provides a differentiated approach to equity investing through a portfolio of companies with strong fundamentals, low debt and good visibility on future results.
A sustainable investment approach
The fund integrates an ESG approach in the investment process, both at a quantitative (exclusion filters) and qualitative level (“best-in-class” selection).
A resilient investment strategy
that may serve as the cornerstone of your portfolio: well established businesses, stable dividends
![]()


| Share class | |
|---|---|
| Category | Equity |
| Risk profile | 4 |
| Recommended investment period | 5 years |
| Isin Code | LU0859660069 |
| Investor profile | Retail |
| Currency | EUR |
| Dividend policy | Accumulation |
| Net Asset Value frequency | Daily |
| Initial Net Asset Value | 1000 EUR |
| Net Asset Value date | 09/07/2024 |
| Net Asset Value | 1 709.37 |
| Monthly report | |
| KIID | |
| Tax publication | |
| Category | Equity |
| Risk profile | 4 |
| Recommended investment period | 5 years |
| Isin Code | LU0859660143 |
| Investor profile | Retail |
| Currency | EUR |
| Dividend policy | Distribution |
| Net Asset Value frequency | Daily |
| Initial Net Asset Value | 1000 EUR |
| Net Asset Value date | 09/07/2024 |
| Net Asset Value | 1 159.72 |
| KIID | |
| Tax publication | |
| Category | Equity |
| Risk profile | 4 |
| Recommended investment period | 5 years |
| Isin Code | LU1664185771 |
| Investor profile | Mandate |
| Currency | EUR |
| Dividend policy | Accumulation |
| Net Asset Value frequency | Daily |
| Initial Net Asset Value | 1000 EUR |
| Net Asset Value date | 09/07/2024 |
| Net Asset Value | 1 260.14 |
| KIID | |
| Tax publication | |
| Category | Equity |
| Risk profile | 4 |
| Recommended investment period | 5 years |
| Isin Code | LU1664185854 |
| Investor profile | Mandate |
| Currency | EUR |
| Dividend policy | Distribution |
| Net Asset Value frequency | Daily |
| Initial Net Asset Value | 1000 EUR |
| Net Asset Value date | 09/07/2024 |
| Net Asset Value | 1 098.70 |
| KIID | |
| Tax publication | |
| Category | Equity |
| Risk profile | 5 |
| Recommended investment period | 5 years |
| Isin Code | LU2108470738 |
| Investor profile | Retail |
| Currency | USD |
| Dividend policy | Accumulation |
| Net Asset Value frequency | Daily |
| Initial Net Asset Value | 1000 USD |
| Net Asset Value date | 09/07/2024 |
| Net Asset Value | 1 132.92 |
| Monthly report | |
| KIID | |
| Tax publication | |
| Category | Equity |
| Risk profile | 4 |
| Recommended investment period | 5 years |
| Isin Code | LU2108470811 |
| Investor profile | Mandate |
| Currency | USD |
| Dividend policy | Accumulation |
| Net Asset Value frequency | Daily |
| Initial Net Asset Value | 1000 USD |
| Net Asset Value date | 05/10/2023 |
| Net Asset Value | 0.00 |
| KIID | |
| Tax publication | |
| Category | Equity |
| Risk profile | 4 |
| Recommended investment period | 5 years |
| Isin Code | LU2108471116 |
| Investor profile | Institutional |
| Currency | EUR |
| Dividend policy | Accumulation |
| Net Asset Value frequency | Daily |
| Initial Net Asset Value | 1000 EUR |
| Net Asset Value date | 09/07/2024 |
| Net Asset Value | 1 554.23 |
| Monthly report | |
| KIID |
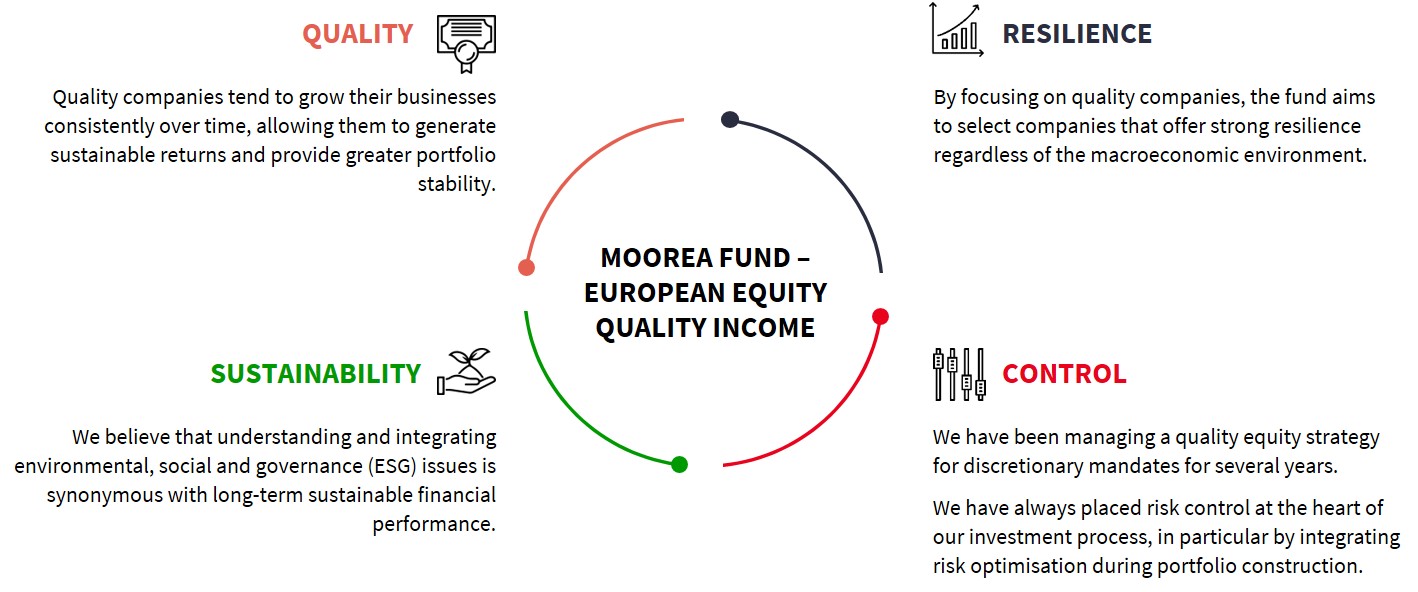
The philosophy of Moorea Fund – European Equity Quality Income is to preserve and enhance our investors’ wealth. The fund's investment strategy is based on 4 strong convictions:
Performances
The investment strategy of the fund has been modified in February 2020.
Performance scenarios
Performance scenarios
Data as of //0/24/0
Hypothetical 10000 EUR investment
| Scenarios | 1 year | 5 years * |
|---|---|---|
| Stress | ||
| What you might get back after costs (EUR) | € 1,807.714 | € 2,006.722 |
| Average return each year (%) | -81.92% | -27.47% |
| Unfavorable | ||
| What you might get back after costs (EUR) | € 7,753.700 | € 8,437.413 |
| Average return each year (%) | -22.46% | -3.34% |
| Moderate | ||
| What you might get back after costs (EUR) | € 9,674.470 | € 10,880.274 |
| Average return each year (%) | -3.26% | 1.7% |
| Favorable | ||
| What you might get back after costs (EUR) | € 12,002.353 | € 13,086.202 |
| Average return each year (%) | 20.02% | 5.53% |
*Recommanded holding period
Download
Performance scenarios
Data as of //0/24/0
Hypothetical 10000 EUR investment
| Scenarios | 1 year | 5 years * |
|---|---|---|
| Stress | ||
| What you might get back after costs (EUR) | € 1,807.873 | € 2,006.781 |
| Average return each year (%) | -81.92% | -27.47% |
| Unfavorable | ||
| What you might get back after costs (EUR) | € 7,920.860 | € 8,438.354 |
| Average return each year (%) | -20.79% | -3.34% |
| Moderate | ||
| What you might get back after costs (EUR) | € 9,674.597 | € 10,900.343 |
| Average return each year (%) | -3.25% | 1.74% |
| Favorable | ||
| What you might get back after costs (EUR) | € 12,002.998 | € 13,089.723 |
| Average return each year (%) | 20.03% | 5.53% |
*Recommanded holding period
Download
Performance scenarios
Data as of //0/24/0
Hypothetical 10000 EUR investment
| Scenarios | 1 year | 5 years * |
|---|---|---|
| Stress | ||
| What you might get back after costs (EUR) | € 1,807.967 | € 2,007.039 |
| Average return each year (%) | -81.92% | -27.47% |
| Unfavorable | ||
| What you might get back after costs (EUR) | € 7,784.789 | € 8,500.994 |
| Average return each year (%) | -22.15% | -3.2% |
| Moderate | ||
| What you might get back after costs (EUR) | € 9,703.389 | € 10,957.324 |
| Average return each year (%) | -2.97% | 1.85% |
| Favorable | ||
| What you might get back after costs (EUR) | € 12,049.801 | € 13,236.484 |
| Average return each year (%) | 20.5% | 5.77% |
*Recommanded holding period
Download
Performance scenarios
Data as of //0/24/0
Hypothetical 10000 EUR investment
| Scenarios | 1 year | 5 years * |
|---|---|---|
| Stress | ||
| What you might get back after costs (EUR) | € 1,974.166 | € 2,146.428 |
| Average return each year (%) | -80.26% | -26.49% |
| Unfavorable | ||
| What you might get back after costs (EUR) | € 7,952.533 | € 8,264.605 |
| Average return each year (%) | -20.47% | -3.74% |
| Moderate | ||
| What you might get back after costs (EUR) | € 9,664.532 | € 10,992.060 |
| Average return each year (%) | -3.35% | 1.91% |
| Favorable | ||
| What you might get back after costs (EUR) | € 12,050.172 | € 12,868.954 |
| Average return each year (%) | 20.5% | 5.17% |
*Recommanded holding period
Download
Performance scenarios
Data as of //0/24/0
Hypothetical 10000 USD investment
| Scenarios | 1 year | 5 years * |
|---|---|---|
| Stress | ||
| What you might get back after costs (USD) | $ 3,008.374 | $ 2,533.425 |
| Average return each year (%) | -69.92% | -24.01% |
| Unfavorable | ||
| What you might get back after costs (USD) | $ 6,687.336 | $ 7,654.654 |
| Average return each year (%) | -33.13% | -5.21% |
| Moderate | ||
| What you might get back after costs (USD) | $ 9,551.058 | $ 10,455.428 |
| Average return each year (%) | -4.49% | 0.89% |
| Favorable | ||
| What you might get back after costs (USD) | $ 12,398.830 | $ 14,447.951 |
| Average return each year (%) | 23.99% | 7.64% |
*Recommanded holding period
Download
Performance scenarios
Data as of //0/24/0
Hypothetical 10000 USD investment
| Scenarios | 1 year | 5 years * |
|---|---|---|
| Stress | ||
| What you might get back after costs (USD) | $ 0.000 | $ 0.000 |
| Average return each year (%) | 0% | 0% |
| Unfavorable | ||
| What you might get back after costs (USD) | $ 0.000 | $ 0.000 |
| Average return each year (%) | 0% | 0% |
| Moderate | ||
| What you might get back after costs (USD) | $ 0.000 | $ 0.000 |
| Average return each year (%) | 0% | 0% |
| Favorable | ||
| What you might get back after costs (USD) | $ 0.000 | $ 0.000 |
| Average return each year (%) | 0% | 0% |
*Recommanded holding period
Download
Performance scenarios
Data as of //0/24/0
Hypothetical 10000 EUR investment
| Scenarios | 1 year | 5 years * |
|---|---|---|
| Stress | ||
| What you might get back after costs (EUR) | € 4,061.157 | € 3,368.736 |
| Average return each year (%) | -59.39% | -19.56% |
| Unfavorable | ||
| What you might get back after costs (EUR) | € 7,811.609 | € 8,818.184 |
| Average return each year (%) | -21.88% | -2.48% |
| Moderate | ||
| What you might get back after costs (EUR) | € 9,906.897 | € 11,479.736 |
| Average return each year (%) | -0.93% | 2.8% |
| Favorable | ||
| What you might get back after costs (EUR) | € 12,093.349 | € 13,877.658 |
| Average return each year (%) | 20.93% | 6.77% |
*Recommanded holding period
Download
Past performance should not be seen as an indicator of future performance.
Associated risks
- Investments may be subject to market fluctuations and the price and value of investments and the income derived from them can go down as well as up. Your capital may be at risk and you may not get back the amount you invest.
- Liquidity Risk: Refers to the possibility that the fund may loose money or be prevented from earning capital gains if it cannot sell a security at the time and price that is most beneficial to the fund and may be unable to raise cash to meet redemption requests.
- Exchange Risk: Refers to the risk of movements in currency exchange rates that can adversely affect the return of your investment.
- Operational Risk: It refers to a failure or delay in the system, processes and controls of the fund or its service providers which could lead to losses for the fund.
- Market Risk: Refers to the possibility for an investor to experience losses due to the overall performance of the financial markets.
- Concentration Risk: Refers to the risk of significant losses if the fund holds a large position in a particular investment that declines in value or is otherwise adversely affected, including default of the issuer.
Before investing, investors must be aware that certain markets may be subject to rapid fluctuations and are speculative or lacking in liquidity. Accordingly, certain assets or categories of assets listed on this website may not be appropriate for some investors. Investors are therefore urged to seek the advice of their financial advisor or intermediary in order to assess the particular nature of an investment and the risks involved and its compatibility with their individual investment profile and objectives.