
Moorea Fund - Emerging Markets Equity
Moorea Fund - Emerging Markets Equity seeks to provide long term capital appreciation over a cycle primarily through investments in a diversified portfolio of emerging markets equity securities. The aim of the sub-fund is to identify companies that exhibit quality and income characteristics, the portfolio Investment and Sub-Investment Managers believe are well positioned to benefit from Emerging Market dynamics.
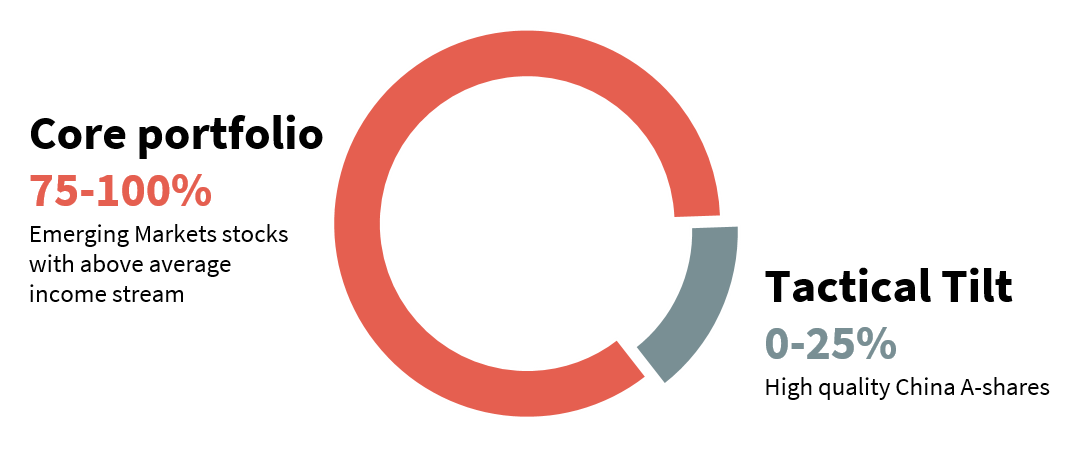
A fund focusing on high-quality companies within global emerging markets, while trying to capture unique growth opportunities in China mainland thanks to a tilt to China A-Shares.
Key features
Quality-driven strategy focusing on dividend growth and dividend yield of Emerging Markets equities
The fund aims to provide exposure to the long-term structural growth of emerging markets equities. It focuses on high-yielding emerging markets companies with sustainable dividend growth has historically provided higher returns with less volatility. Emerging markets firms that grow their dividends tend to demonstrate better corporate governance and a greater focus on minority shareholders’ returns. In turn, this indicates confidence in their business to the marketplace.
Priviledged access to equities of the chinese market (China A-shares)
Moorea Fund Emerging Markets Equity offers exposure to companies listed on the Shenzhen and Shanghai stock exchanges, two markets that, due to regulatory restrictions, remain difficult for foreign investors to access. The A-Share sleeve invests in well established companies, which exhibit high visibility on future earnings growth, market leadership through product cycles and internally funded growth, with little history of equity dilution.
A fund managed by BlackRock, one of the world’s leading asset managers
BlackRock relies on a dedicated global platform to deploy capital in emerging markets. The platform includes 40 experienced investment profesionnals of 18 nationalities, speaking 25 languages. On-the-ground research and regular access to local contacts are at the heart of the fund’s investment process.
Notice to shareholders


| Share class | |
|---|---|
| Category | Equity |
| Risk profile | 4 |
| Recommended investment period | 5 years |
| Isin Code | LU1958314913 |
| Investor profile | Retail |
| Currency | EUR |
| Dividend policy | Accumulation |
| Net Asset Value frequency | Daily |
| Initial Net Asset Value | 250 EUR |
| Net Asset Value date | 13/05/2024 |
| Net Asset Value | 246.93 |
| Monthly report | |
| KIID | |
| Tax publication | |
| Category | Equity |
| Risk profile | 4 |
| Recommended investment period | 5 years |
| Isin Code | LU1958315050 |
| Investor profile | Institutional |
| Currency | EUR |
| Dividend policy | Accumulation |
| Net Asset Value frequency | Daily |
| Initial Net Asset Value | 250 EUR |
| Net Asset Value date | 13/05/2024 |
| Net Asset Value | 257.68 |
| Monthly report | |
| KIID | |
| Tax publication | |
| Category | Equity |
| Risk profile | 4 |
| Recommended investment period | 5 years |
| Isin Code | LU1958315134 |
| Investor profile | Mandate |
| Currency | EUR |
| Dividend policy | Accumulation |
| Net Asset Value frequency | Daily |
| Initial Net Asset Value | 250 EUR |
| Net Asset Value date | 13/05/2024 |
| Net Asset Value | 251.88 |
| KIID | |
| Tax publication | |
| Category | Equity |
| Risk profile | 4 |
| Recommended investment period | 5 years |
| Isin Code | LU1958315217 |
| Investor profile | Retail |
| Currency | USD |
| Dividend policy | Accumulation |
| Net Asset Value frequency | Daily |
| Initial Net Asset Value | 250 USD |
| Net Asset Value date | 13/05/2024 |
| Net Asset Value | 237.82 |
| Monthly report | |
| KIID | |
| Tax publication | |
| Category | Equity |
| Risk profile | 4 |
| Recommended investment period | 5 years |
| Isin Code | LU1958315308 |
| Investor profile | Institutional |
| Currency | USD |
| Dividend policy | Accumulation |
| Net Asset Value frequency | Daily |
| Initial Net Asset Value | 250 USD |
| Net Asset Value date | 13/05/2024 |
| Net Asset Value | 248.09 |
| KIID | |
| Tax publication | |
| Category | Equity |
| Risk profile | 4 |
| Recommended investment period | 5 years |
| Isin Code | LU1958315480 |
| Investor profile | Mandate |
| Currency | USD |
| Dividend policy | Accumulation |
| Net Asset Value frequency | Daily |
| Initial Net Asset Value | 250 USD |
| Net Asset Value date | 13/05/2024 |
| Net Asset Value | 242.59 |
| KIID | |
| Tax publication | |
| Category | Equity |
| Risk profile | 4 |
| Recommended investment period | 5 years |
| Isin Code | LU1958315563 |
| Investor profile | Kleinwort Hambros clients |
| Currency | GBP |
| Dividend policy | Accumulation |
| Net Asset Value frequency | Daily |
| Initial Net Asset Value | 250 GBP |
| Net Asset Value date | 13/05/2024 |
| Net Asset Value | 253.79 |
| Monthly report | |
| KIID | |
| Tax publication | |
| Category | Equity |
| Risk profile | 4 |
| Recommended investment period | 5 years |
| Isin Code | LU2439365607 |
| Investor profile | Dedicated to SG29 Haussmann |
| Currency | EUR |
| Dividend policy | Accumulation |
| Net Asset Value frequency | Daily |
| Initial Net Asset Value | 250 EUR |
| Net Asset Value date | 13/05/2024 |
| Net Asset Value | 228.02 |
| KIID |
Performances
-
Performance scenarios
Data as of //0/24/0
Hypothetical 10000 EUR investment
| Scenarios | 1 year | 5 years * |
|---|---|---|
| Stress | ||
| What you might get back after costs (EUR) | € 2,546.005 | € 2,053.211 |
| Average return each year (%) | -74.54% | -27.14% |
| Unfavorable | ||
| What you might get back after costs (EUR) | € 7,313.698 | € 7,422.116 |
| Average return each year (%) | -26.86% | -5.79% |
| Moderate | ||
| What you might get back after costs (EUR) | € 9,609.467 | € 10,902.098 |
| Average return each year (%) | -3.91% | 1.74% |
| Favorable | ||
| What you might get back after costs (EUR) | € 13,752.533 | € 15,146.577 |
| Average return each year (%) | 37.53% | 8.66% |
*Recommanded holding period
Download
Performance scenarios
Data as of //0/24/0
Hypothetical 10000 EUR investment
| Scenarios | 1 year | 5 years * |
|---|---|---|
| Stress | ||
| What you might get back after costs (EUR) | € 2,546.904 | € 2,053.371 |
| Average return each year (%) | -74.53% | -27.14% |
| Unfavorable | ||
| What you might get back after costs (EUR) | € 7,313.698 | € 7,555.705 |
| Average return each year (%) | -26.86% | -5.45% |
| Moderate | ||
| What you might get back after costs (EUR) | € 9,655.901 | € 10,954.778 |
| Average return each year (%) | -3.44% | 1.84% |
| Favorable | ||
| What you might get back after costs (EUR) | € 13,881.321 | € 15,436.774 |
| Average return each year (%) | 38.81% | 9.07% |
*Recommanded holding period
Download
Performance scenarios
Data as of //0/24/0
Hypothetical 10000 EUR investment
| Scenarios | 1 year | 5 years * |
|---|---|---|
| Stress | ||
| What you might get back after costs (EUR) | € 2,545.724 | € 2,052.452 |
| Average return each year (%) | -74.54% | -27.15% |
| Unfavorable | ||
| What you might get back after costs (EUR) | € 7,313.698 | € 7,493.958 |
| Average return each year (%) | -26.86% | -5.61% |
| Moderate | ||
| What you might get back after costs (EUR) | € 9,623.245 | € 10,917.730 |
| Average return each year (%) | -3.77% | 1.77% |
| Favorable | ||
| What you might get back after costs (EUR) | € 13,807.206 | € 15,254.356 |
| Average return each year (%) | 38.07% | 8.81% |
*Recommanded holding period
Download
Performance scenarios
Data as of //0/24/0
Hypothetical 10000 USD investment
| Scenarios | 1 year | 5 years * |
|---|---|---|
| Stress | ||
| What you might get back after costs (USD) | $ 2,300.228 | $ 1,933.265 |
| Average return each year (%) | -77% | -28.01% |
| Unfavorable | ||
| What you might get back after costs (USD) | $ 6,252.773 | $ 6,726.927 |
| Average return each year (%) | -37.47% | -7.62% |
| Moderate | ||
| What you might get back after costs (USD) | $ 9,373.493 | $ 9,493.858 |
| Average return each year (%) | -6.27% | -1.03% |
| Favorable | ||
| What you might get back after costs (USD) | $ 14,730.303 | $ 16,922.650 |
| Average return each year (%) | 47.3% | 11.09% |
*Recommanded holding period
Download
Performance scenarios
Data as of //0/24/0
Hypothetical 10000 USD investment
| Scenarios | 1 year | 5 years * |
|---|---|---|
| Stress | ||
| What you might get back after costs (USD) | $ 2,301.857 | $ 1,940.184 |
| Average return each year (%) | -76.98% | -27.96% |
| Unfavorable | ||
| What you might get back after costs (USD) | $ 6,299.172 | $ 6,852.406 |
| Average return each year (%) | -37.01% | -7.28% |
| Moderate | ||
| What you might get back after costs (USD) | $ 9,373.493 | $ 9,663.202 |
| Average return each year (%) | -6.27% | -0.68% |
| Favorable | ||
| What you might get back after costs (USD) | $ 14,873.385 | $ 17,239.156 |
| Average return each year (%) | 48.73% | 11.51% |
*Recommanded holding period
Download
Performance scenarios
Data as of //0/24/0
Hypothetical 10000 USD investment
| Scenarios | 1 year | 5 years * |
|---|---|---|
| Stress | ||
| What you might get back after costs (USD) | $ 2,301.299 | $ 1,934.260 |
| Average return each year (%) | -76.99% | -28% |
| Unfavorable | ||
| What you might get back after costs (USD) | $ 6,277.851 | $ 6,794.424 |
| Average return each year (%) | -37.22% | -7.44% |
| Moderate | ||
| What you might get back after costs (USD) | $ 9,373.493 | $ 9,582.855 |
| Average return each year (%) | -6.27% | -0.85% |
| Favorable | ||
| What you might get back after costs (USD) | $ 14,789.247 | $ 17,041.866 |
| Average return each year (%) | 47.89% | 11.25% |
*Recommanded holding period
Download
Performance scenarios
Data as of //0/24/0
Hypothetical 10000 GBP investment
| Scenarios | 1 year | 5 years * |
|---|---|---|
| Stress | ||
| What you might get back after costs (GBP) | GBP 3,134.827 | GBP 2,626.059 |
| Average return each year (%) | -68.65% | -23.46% |
| Unfavorable | ||
| What you might get back after costs (GBP) | GBP 7,522.230 | GBP 7,642.090 |
| Average return each year (%) | -24.78% | -5.24% |
| Moderate | ||
| What you might get back after costs (GBP) | GBP 9,624.546 | GBP 12,004.449 |
| Average return each year (%) | -3.75% | 3.72% |
| Favorable | ||
| What you might get back after costs (GBP) | GBP 13,507.212 | GBP 17,700.929 |
| Average return each year (%) | 35.07% | 12.1% |
*Recommanded holding period
Download
Performance scenarios
Data as of //0/24/0
Hypothetical 10000 EUR investment
| Scenarios | 1 year | 5 years * |
|---|---|---|
| Stress | ||
| What you might get back after costs (EUR) | € 2,604.398 | € 2,557.103 |
| Average return each year (%) | -73.96% | -23.87% |
| Unfavorable | ||
| What you might get back after costs (EUR) | € 7,313.698 | € 7,639.168 |
| Average return each year (%) | -26.86% | -5.24% |
| Moderate | ||
| What you might get back after costs (EUR) | € 9,609.467 | € 10,902.098 |
| Average return each year (%) | -3.91% | 1.74% |
| Favorable | ||
| What you might get back after costs (EUR) | € 13,752.533 | € 15,146.577 |
| Average return each year (%) | 37.53% | 8.66% |
*Recommanded holding period
Download
Past performance should not be seen as an indicator of future performance.
Associated risks
- Investments may be subject to market fluctuations and the price and value of investments and the income derived from them can go down as well as up. Your capital may be at risk and you may not get back the amount you invest.
- Market risk: The value of equity and equity-linked securities may fluctuate in response to the performance of individual companies and general market conditions.
- Emerging Markets: Emerging markets may be subject to increased political, regulatory and economic instability, less developed custody and settlement practices, poor transparency and greater volatility.
- Financial risks: Emerging market currencies may be subject to volatile price movements. Emerging market securities may also be subject to higher volatility and be more difficult to sell than non-emerging market securities.
- China: Investments in China are subject to certain additional risks, particularly regarding the ability to deal in equity securities in China due to issues relating to liquidity and the repatriation of capital. As a result, the Fund may choose to gain exposure to Chinese equities indirectly and may be unable to gain full exposure to Chinese equity markets.
- Liquidity risk: The Fund may loose money or be prevented from earning capital gains if it cannot sell a security at the time and price is most beneficial to the Fund and may unable to raise cash to meet redemption requests.
- Exchange Risk: Refers to the risk of movements in currency exchange rates that can adversely affect the return of your investment.
- Operational Risk: It refers to a failure or delay in the system, processes and controls of the fund or its service providers which could lead to losses for the fund.
Before investing, investors must be aware that certain markets may be subject to rapid fluctuations and are speculative or lacking in liquidity. Accordingly, certain assets or categories of assets listed on this website may not be appropriate for some investors. Investors are therefore urged to seek the advice of their financial advisor or intermediary in order to assess the particular nature of an investment and the risks involved and its compatibility with their individual investment profile and objectives.